How to Calculate TAM the Modern AI Way [Workflow Included]
A practical workflow for calculating TAM the AI way — from formulas and bottom-up sizing to using semantic search and lookalike company APIs to turn TAM into a live account map.
Summarize this blog post with
Most guides on how to calculate TAM give you the same formula: count potential customers, multiply by average annual contract value, and call it a market size. That is technically correct. It is also where most TAM work becomes useless.
The old way to calculate TAM starts with a market report. The new way starts with an ICP hypothesis, then uses AI to find the companies that look, behave, and buy like that ideal market.
Over the past few years building CompanyEnrich, I have seen the same pattern across founders, RevOps teams, and sales operators. The teams that win do not just ask, "How big is this market?" They ask, "Which companies are actually in this market, which ones can we serve now, and which ones should sales prioritize first?"
That is the real shift.
What this guide covers:
- How to calculate TAM using the standard formulas investors expect.
- How TAM, SAM, and SOM differ in practical B2B planning.
- Why bottom-up TAM is usually stronger than top-down market sizing.
- How AI-powered semantic search and similar company APIs turn TAM into a live account map.
- How CompanyEnrich fits into a practical workflow for account-level TAM research.
What Is TAM and Why Does It Matter?
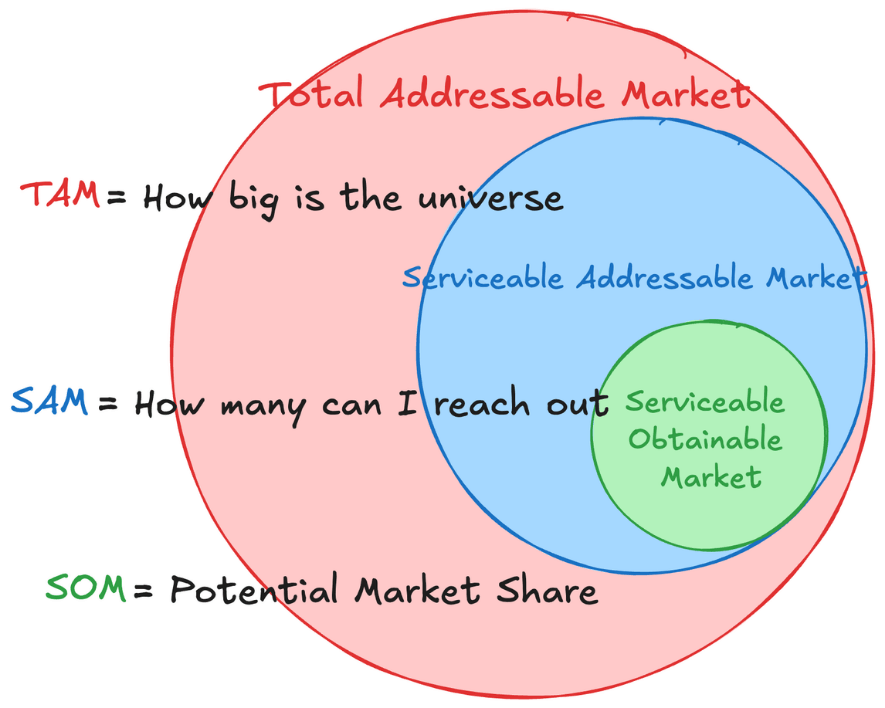
Total Addressable Market, or TAM, is the maximum annual revenue opportunity available for a product if it captured 100% of the relevant market. In plain English, it answers: "How much revenue could this business theoretically generate if every eligible buyer bought from us?"
For B2B SaaS, the simplest TAM formula is:
TAM = Number of potential customers x Average annual contract valueIf there are 20,000 qualified companies in your target market and your realistic annual contract value is $12,000, your TAM is:
20,000 x $12,000 = $240,000,000 TAMThat number matters because it shapes decisions across the company:
- Investors use it to understand whether the opportunity can support venture-scale returns.
- Founders use it to decide whether a market is worth entering.
- RevOps teams use it to design territories, quotas, and account scoring.
- Product marketers use it to prioritize verticals and positioning.
- Sales leaders use it to decide where outbound motion should focus.
Salesforce describes TAM, SAM, and SOM as a practical way to define how much opportunity exists, how much of that opportunity is reachable, and how much is realistically obtainable. That last distinction is where many teams get into trouble.
TAM is not a revenue forecast.
It is a ceiling.
What to do: Use TAM to define the size of the opportunity, then use SAM and SOM to pressure-test what your team can actually reach and win.
How to Calculate TAM, SAM, and SOM
When people search for how to calculate TAM, they usually also need TAM, SAM, and SOM. These three numbers work together.
| Metric | What it means | Question it answers | B2B example |
|---|---|---|---|
| TAM | Total Addressable Market | How big could this market be at 100% adoption? | All companies globally that could buy your compliance platform |
| SAM | Serviceable Addressable Market | Which part of the market can we serve with our current product and GTM model? | EU fintech companies with 100 to 1,000 employees |
| SOM | Serviceable Obtainable Market | What can we realistically capture in the next 1-3 years? | The subset your sales team can reach and close based on capacity |
Think of these as nested filters.
TAM is the broad opportunity. SAM applies your current constraints. SOM adds sales capacity, budget, competition, and timing.
Here is a simple example:
TAM:
50,000 global companies x $10,000 ACV = $500M

SAM:
12,000 companies in your current target geographies x $10,000 ACV = $120M

SOM:
600 realistically winnable accounts over 3 years x $10,000 ACV = $6M
That final number might look small compared with the TAM. Good. It should. A credible SOM is usually more useful than an inflated TAM.
The mistake is pretending the outer circle is the plan.
What to do: In your TAM model, keep three separate tabs or sections for TAM, SAM, and SOM. If you cannot explain the filter from one layer to the next, the model is not ready.
What Are the Traditional Ways to Calculate TAM?
There are three classic ways to calculate total addressable market: top-down, bottom-up, and value theory. Each one has a place. None of them is enough by itself.
Top-down TAM
Top-down TAM starts with a broad market number from an analyst report, government dataset, or industry research source. Then you apply filters.
Example:
Global software spend x compliance software share x North America share x mid-market share = TAMThis is fast, and it is useful as a sanity check. For example, Gartner forecasted worldwide IT spending to total $6.31 trillion in 2026, with software spending projected at $1.443 trillion. That kind of data helps you understand the macro ceiling.
But top-down TAM has a weakness: it hides assumptions.
If you say, "The software market is huge, and we only need 1%," you have not explained who buys, why they buy, how much they pay, or how you will reach them.
Bottom-up TAM
Bottom-up TAM starts with actual customers or accounts. You define the type of company that can buy, count the number of qualified accounts, then multiply by realistic ACV.
Bottom-up TAM = Qualified account count x Average annual contract valueThis is usually the strongest method for B2B SaaS because it maps directly to GTM execution.
You are not saying, "This market is big." You are saying, "Here are the 18,430 companies that match our ICP, here is how much they can pay, and here is how we will reach them."
That is a different level of credibility.
Value-theory TAM
Value-theory TAM is useful when you are creating a new category or replacing a workflow that does not already have a clear software budget.
Instead of asking, "What do companies already spend on this category?" you ask:
Customer value created x realistic value capture rate = Value-theory TAMFor example, if your product saves $50,000 per year in labor cost for each customer, you might model a value capture rate of 10-20% and price accordingly.
This works well for category-creating products. It also becomes dangerous when the value assumptions are not validated by willingness to pay.
| TAM method | Best for | Main advantage | Main risk |
|---|---|---|---|
| Top-down | Mature markets with good analyst data | Fast macro validation | Inflated assumptions |
| Bottom-up | B2B SaaS, RevOps, account-based GTM | Defensible and actionable | Requires good company data |
| Value theory | New categories or disruptive workflows | Captures market expansion | Can overestimate willingness to pay |
Investors often prefer bottom-up reasoning because it forces founders to define the target customer, willingness to pay, and GTM path. Andreessen Horowitz has made this point clearly in its startup metrics writing: the best market sizing work is connected to customer profile, pricing, and distribution.
What to do: Use top-down TAM as a ceiling check, bottom-up TAM as your primary B2B model, and value theory only when existing category spend does not capture the customer value you create.
Why the Old Way to Calculate TAM Breaks Down
The traditional way to calculate TAM was built for board slides and pitch decks. It was not built for live GTM execution.
That creates a problem.
A static TAM model might tell you that your market is worth $800 million. But it will not tell your sales team which accounts to call tomorrow. It will not tell you which companies recently raised funding, changed their tech stack, opened a new hiring plan, or started describing themselves in language that matches your ICP.
In B2B, the market is not a fixed spreadsheet.
Companies change constantly. They hire. They shrink. They enter new verticals. They install tools. They redesign websites. They move from startup to scaleup. They stop being a fit, and new companies become a fit.
That is why static TAM decays.
This is especially painful for RevOps and outbound teams. A TAM slide can look impressive while the actual account list underneath it is stale, duplicated, and full of companies that no longer match the buying segment.
| Traditional TAM | AI-powered account-level TAM |
|---|---|
| Starts with analyst reports | Starts with your ICP hypothesis and best-fit signals |
| Uses broad market categories | Uses semantic company descriptions and real account attributes |
| Produces a market number | Produces a company list and a market number |
| Updated quarterly or annually | Refreshed as new companies and signals appear |
| Useful for fundraising narrative | Useful for fundraising and GTM execution |
| Often disconnected from sales workflows | Built to feed CRM, outbound, territory planning, and scoring |
Here is the core idea:
Traditional TAM helps you estimate the market. AI-powered TAM helps you find the actual companies inside that market.
The math is not the hard part anymore. The hard part is discovering, validating, deduplicating, and segmenting the right accounts.
That is where AI changes the workflow.
What to do: Keep the traditional formulas, but replace manual account discovery with semantic search, lookalike company discovery, enrichment, and automated refresh cycles.
How to Calculate TAM with AI
To calculate TAM with AI, you still need the same basic formula:
Qualified accounts x realistic ACV = TAMAI does not replace the formula. It improves the account discovery layer behind the formula.
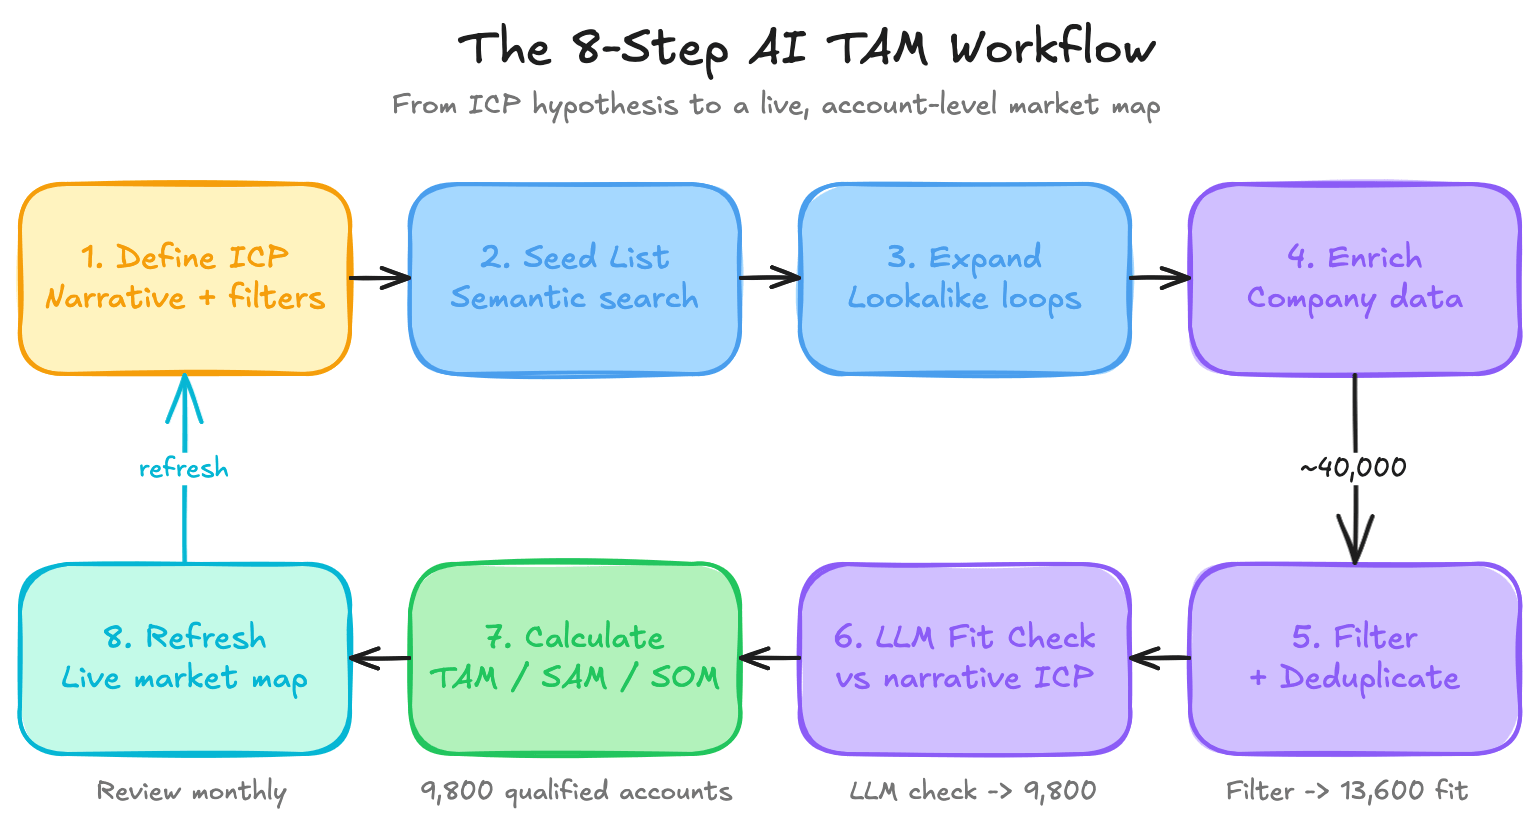
The workflow looks like this:
- Define your ICP in two layers: a broad narrative ICP and precise firmographic filters.
- Build a first seed list with semantic search or lookalike company search.
- Expand that seed list by running selected seed accounts back through a lookalike engine.
- Enrich every candidate company with structured company data.
- Filter by the firmographic ICP fields and deduplicate the account universe.
- Run an LLM fit check using your narrative ICP, without repeating the firmographic filters.
- Segment the focused TAM list by serviceability and likely ACV.
- Calculate TAM, SAM, and SOM, then refresh the model over time.
Let's break that down. To keep the workflow concrete, I will use one running example: a B2B SaaS company selling compliance workflow software to fintech companies.
Step 1: Define your ICP in two layers
Start with a hypothesis about who your ideal customer should be.
At the beginning, you may not have customers yet. That is normal. Your first ICP is often a reasoned guess based on the problem you solve, the buyer you expect to care, the workflow you replace, and the type of company that should feel the pain most strongly.
Do not stop at vague categories like "SaaS companies" or "manufacturing companies." Make the hypothesis concrete:
- Which industry or subcategory should feel the pain most?
- What business model should the ideal customer have?
- Who is the likely buyer or internal champion?
- What workflow, budget, or tool are you replacing?
- What company size should have enough pain and budget?
- What geographies can you realistically serve?
- What technologies, integrations, or operating model make the company a better fit?
If you already have customers, use them to improve the hypothesis:
- Which customers retained longest?
- Which accounts closed fastest?
- Which accounts had the highest ACV?
- Which accounts expanded?
- Which accounts had the clearest pain?
- Which customers were easiest to onboard?
Then split the ICP into two layers.
The first layer is the narrative ICP. This is broad and contextual. It describes the type of business you want, the problem they have, and the market they operate in.
For example:
B2B fintech software companies that sell compliance, risk, onboarding, or fraud workflows to banks and regulated financial institutions.The second layer is the firmographic ICP. This should be precise because you will use it later as a filter.
| ICP layer | What it includes | Example |
|---|---|---|
| Narrative ICP | Industry, business model, buyer pain, category, use case, customer type | "Regtech SaaS selling compliance workflows to financial institutions" |
| Firmographic ICP | Employee count, geography, technology, funding stage, revenue band, company type | 100-1,000 employees, US and UK, uses Salesforce or HubSpot |
The better your ICP definition, the cleaner your TAM model becomes.
When we work on GTM data workflows at CompanyEnrich, this is where I see teams rush. They want the account list immediately. But if the ICP is fuzzy, the search results will be fuzzy too. AI search is powerful, but it still needs a sharp description of what "good fit" means.
The key is to avoid mixing the two layers too early.
Your narrative ICP helps semantic search and LLM evaluation understand meaning. Your firmographic ICP gives you exact fields to filter later.
Step 2: Build the first seed list
The next step is seeding.
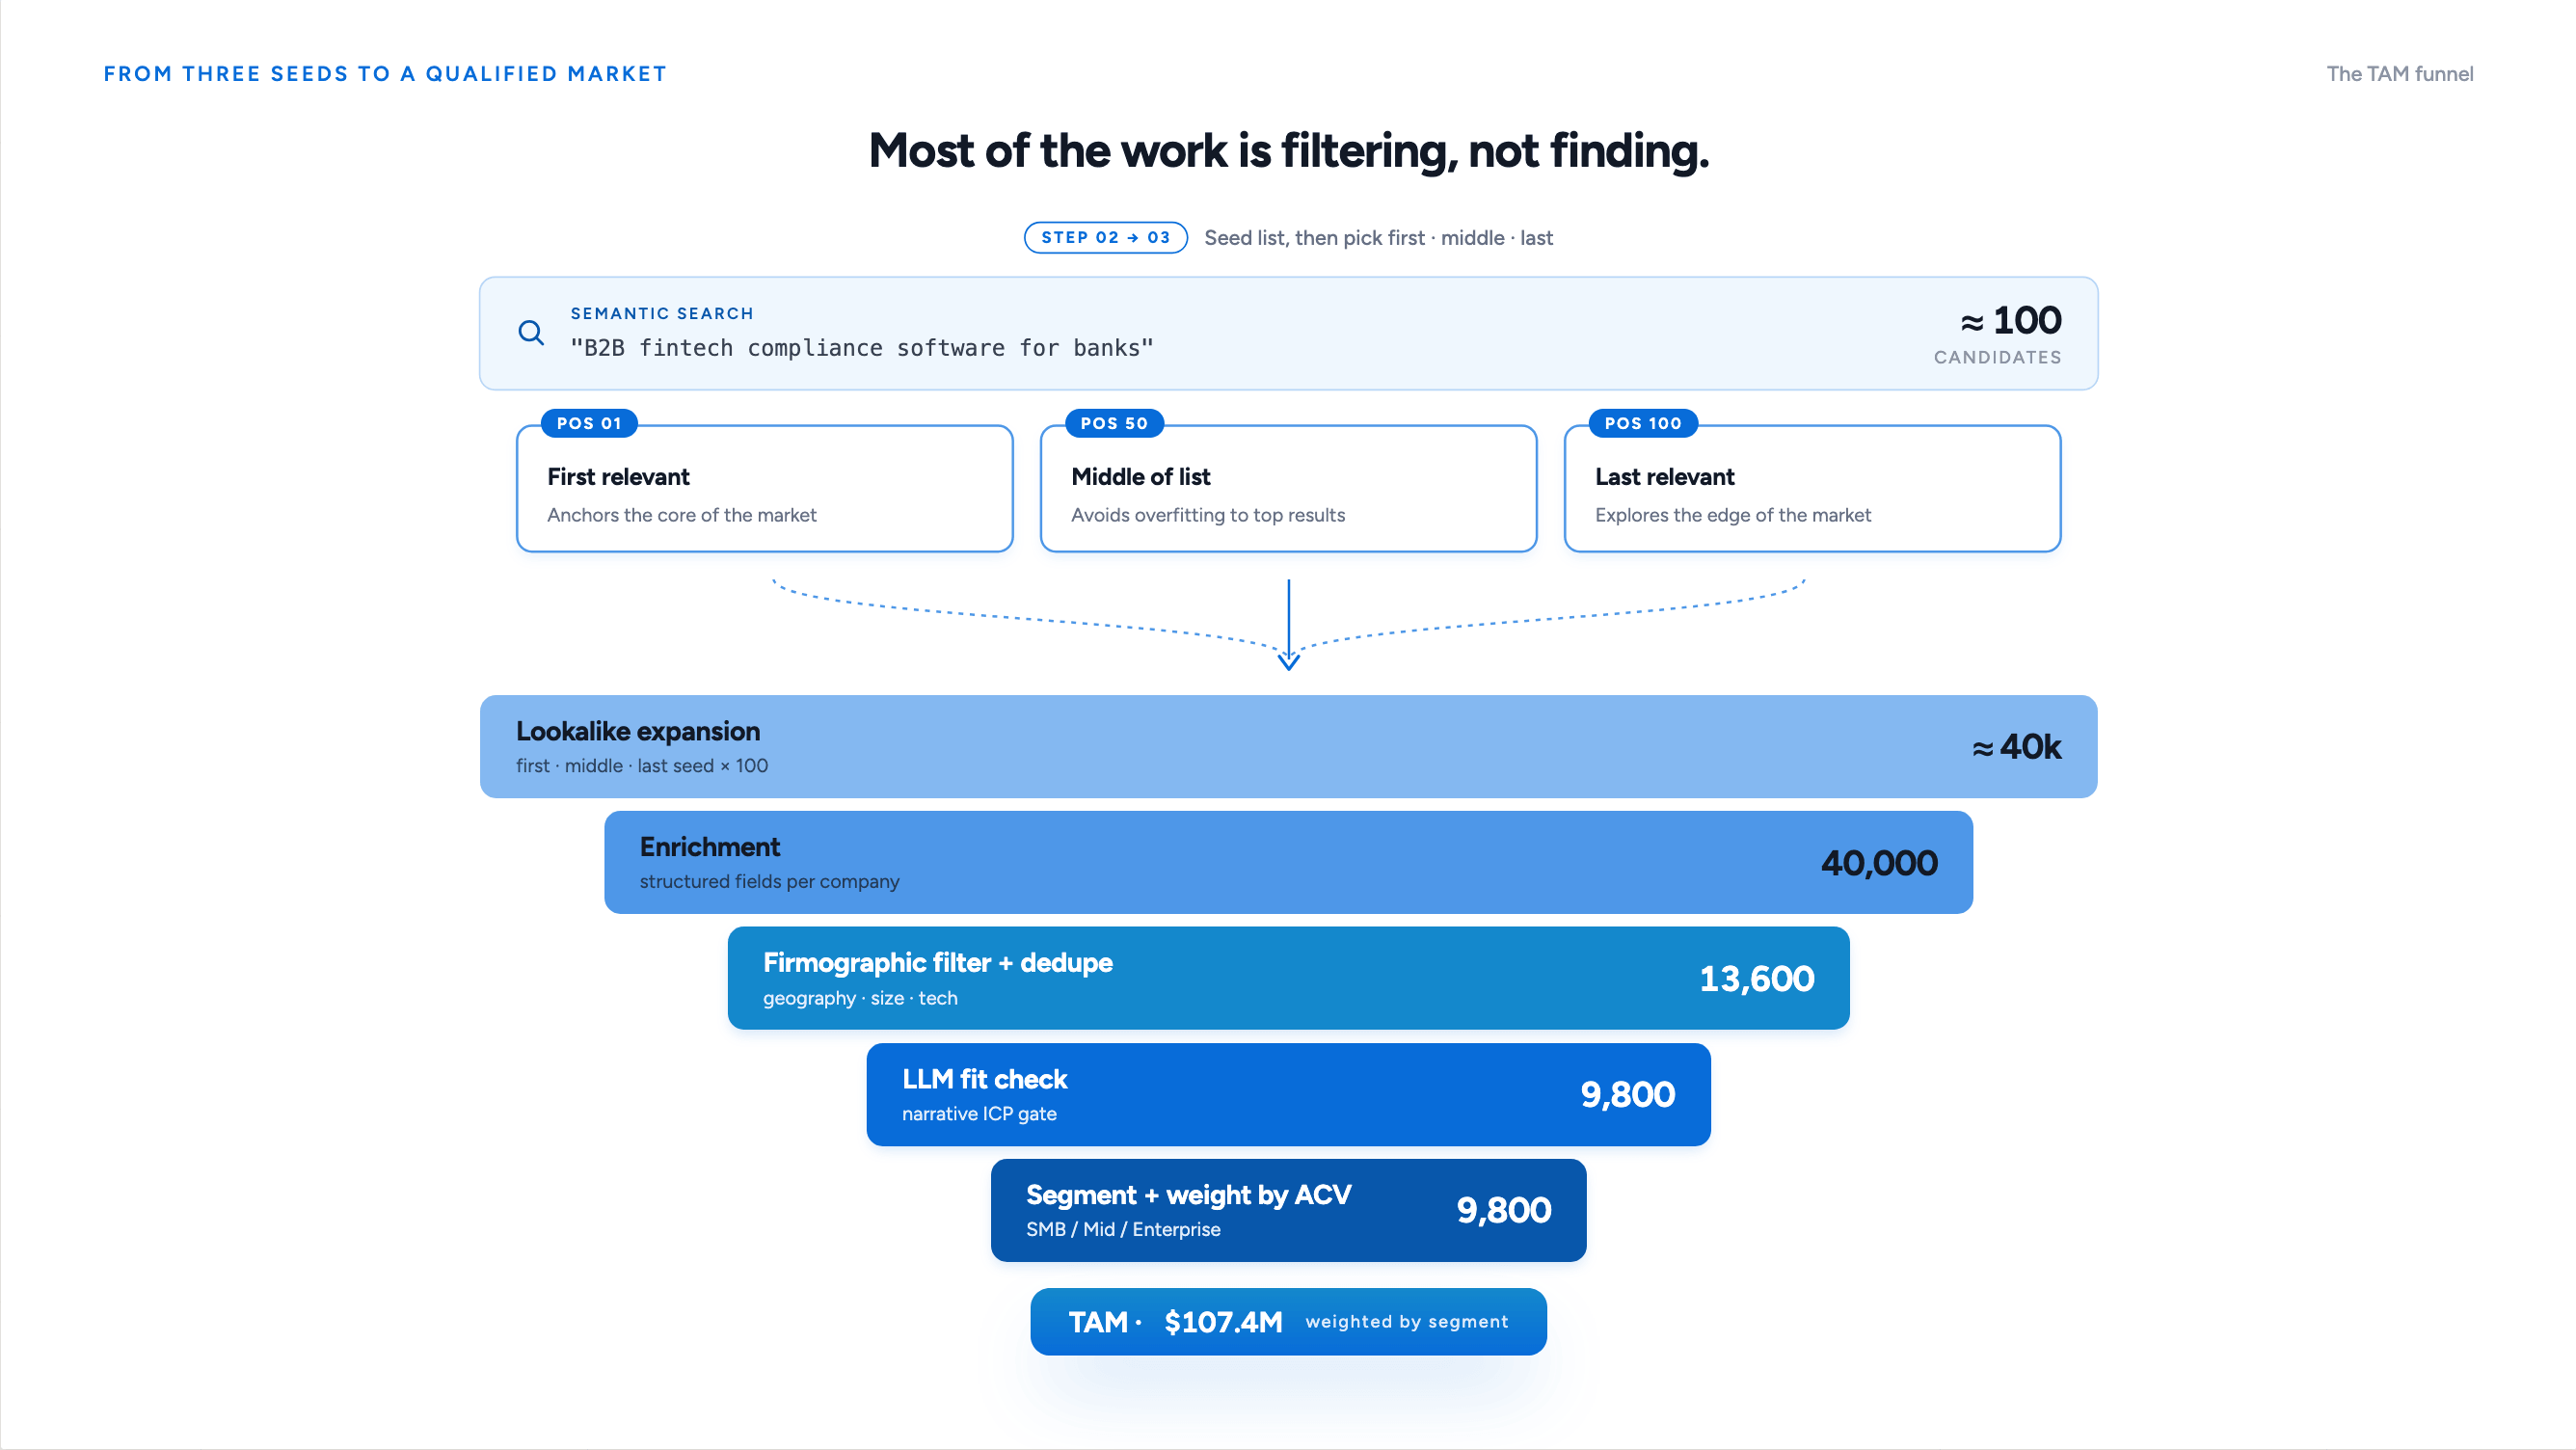
Use either semantic search or similar-company search to get the first candidate list. I would usually start with the first 100 results, because it is enough to see market patterns without letting the dataset drift too far.
You can seed the market in two ways:
- Semantic search: describe the ICP in natural language and pull companies that match it.
- Lookalike search: start from one known good-fit company and pull similar companies.
For semantic search, describe the market the way a founder or RevOps leader would describe it:
"B2B fintech companies building compliance, risk, onboarding, or fraud software for banks""Shopify Plus agencies in North America with 20 to 200 employees""AI infrastructure startups hiring machine learning engineers""Cybersecurity vendors serving mid-market healthcare companies"CompanyEnrich's company search API supports semantic queries alongside filters like country, company size, industry, revenue, and technologies. For the seed step, keep the semantic query close to your narrative ICP and use only light filters. Save the strict firmographic filtering for Step 5, when you have a larger candidate universe.
Here is a simplified REST example. Check the current CompanyEnrich API docs for exact production parameters.
curl --request POST \
  --url "https://api.companyenrich.com/companies/search/scroll" \
  --header "Authorization: Bearer $COMPANYENRICH_API_KEY" \
  --header "accept: application/json" \
  --header "content-type: application/json" \
  --data '{
    "pageSize": 100,
    "semanticQuery": "B2B fintech companies building compliance, risk, onboarding, or fraud software for banks",
    "semanticWeight": 0.7,
    "countries": ["US", "GB", "DE"]
  }'
The goal of this step is not to finish the TAM model. The goal is to create a high-quality seed set that represents the market.
Step 3: Expand the seed list with lookalike loops
Once you have your first seed list, use it to expand the market.
Take three companies from the seed set:
- The first highly relevant result.
- One result from the middle of the list.
- The last result that still looks relevant enough to inspect.
Then run each of those companies through a lookalike engine.
This gives you three useful expansion paths:
- The first result often gives you the obvious core of the market.
- The middle result helps you avoid overfitting to only the top-ranked examples.
- The last relevant result helps you explore the edge of the market without relying only on the top-ranked examples.
In CompanyEnrich, the Similar Companies API can be used to find companies related to a seed company. For TAM work, this matters because lookalikes help surface companies that do not share the same rigid industry code but still behave like your ICP.
Here is what that lookalike expansion call can look like:
curl --request POST \
  --url "https://api.companyenrich.com/companies/similar" \
  --header "Authorization: Bearer $COMPANYENRICH_API_KEY" \
  --header "accept: application/json" \
  --header "content-type: application/json" \
  --data '{
    "domains": ["example-seed-company.com"],
    "pageSize": 100,
    "similarityWeight": 0.7,
    "countries": ["US", "GB", "DE"]
  }'
This is where the market starts to become a map.
You are no longer saying, "Find companies with this keyword." You are saying, "Here are companies that match my market. Show me more companies with the same underlying shape."
Step 4: Enrich every matched company
After semantic search and lookalike expansion, enrich the companies.
You want fields like:
- Company name.
- Domain.
- Description.
- Industry.
- Employee count.
- Location.
- Technologies used.
- Social profiles.
- Funding stage, if available.
- Hiring signals, if available.
- Headcount or department trends, if available.
Company enrichment turns a raw search result into a usable TAM record. It also lets you filter out false positives.
For example, your semantic search may return companies that mention "compliance" on their websites but are actually consulting firms, law firms, or content publishers. Enrichment helps you separate true software buyers from noisy matches.
For this layer, CompanyEnrich's company enrichment API can be used to retrieve company-level data from a domain or company identity.
For a single company, the enrichment call can be as simple as:
curl --request GET \
  --url "https://api.companyenrich.com/companies/enrich?domain=example.com" \
  --header "Authorization: Bearer $COMPANYENRICH_API_KEY" \
  --header "accept: application/json"
Step 5: Filter by firmographics and deduplicate
Now clean the universe.
This is not glamorous. It matters more than most teams admit.
First, apply the firmographic ICP filters you defined in Step 1:
- Companies outside your geography.
- Companies below or above your size band.
- Companies outside your target revenue band.
- Companies missing required technologies.
- Companies outside your funding, maturity, or business model criteria.
Then deduplicate. This matters because semantic search and lookalike expansion will often return the same company multiple times.
When we test this workflow, duplicate domains usually become one of the first cleanup problems. Semantic search and lookalike expansion often find the same company through different paths, so domain-level dedupe is not optional.
You need to remove:
- Duplicate domains.
- Subsidiaries that should roll up into parent accounts.
- Inactive or irrelevant companies.
- Companies that passed a keyword match but not the actual business context.
- Companies that cannot realistically buy at your ACV.
The goal is not to make the biggest possible TAM. The goal is to make the most defensible TAM.
If your original search returns 40,000 accounts and your filtered universe lands at 14,500, that is not a failure. That is the work.
In the running compliance SaaS example, this step might reduce the candidate universe to:
13,600 firmographic-fit accountsStep 6: Run an LLM fit check against the narrative ICP
Now use an LLM as the final qualitative filter.
This is the step most traditional TAM workflows miss.
At this point, do not ask the LLM to judge firmographics again. You already filtered by geography, employee count, technologies, and other structured fields. Instead, give the LLM the narrative ICP and the company description, then ask whether the company is a real fit.
The prompt can be simple:
You are reviewing companies for an account-level TAM model.

Our narrative ICP:
B2B fintech software companies that sell compliance, risk, onboarding, or fraud workflows to banks, lenders, payment companies, or regulated financial institutions.

Do not reject companies based on employee count, geography, funding stage, or technology stack. Those filters were already applied.

For each company, classify it as:
- ICP fit
- Adjacent fit
- Not a fit

Return JSON with:
- company_domain
- fit_status
- confidence
- one_sentence_reason
Then run this prompt across the enriched company list.
This gives you a focused TAM list. The LLM removes companies that passed structured filters but are not truly in the market, such as agencies, media sites, consulting firms, unrelated software companies, or companies using the right words in the wrong context.
The result is a sharper account universe.
Not every company with the right headcount and geography belongs in TAM. The LLM fit check helps catch that.
In the running example, the LLM fit check might reduce 13,600 firmographic-fit accounts to:
9,800 qualified accountsThat 9,800-account list is the focused TAM universe.
Step 7: Segment accounts and calculate TAM, SAM, and SOM
Not every account in the TAM is worth the same amount.
Segment by likely annual contract value:
| Segment | Account criteria | Example ACV | Notes |
|---|---|---|---|
| SMB | 20-99 employees, lighter use case | $3,000 | Often self-serve or low-touch |
| Mid-market | 100-999 employees, clear team owner | $12,000 | Good fit for outbound and partner-led sales |
| Enterprise | 1,000+ employees, multiple teams | $60,000 | Longer cycle, higher serviceability constraints |
Then calculate weighted TAM by multiplying each segment's account count by that segment's ACV, and summing the results:
(SMB accounts x SMB ACV) + (Mid-market accounts x Mid-market ACV) + (Enterprise accounts x Enterprise ACV) = TAMThis is much better than applying one blended ACV across every account, and it is worth seeing why.
In the running example, the 9,800 qualified accounts split across segments like this:
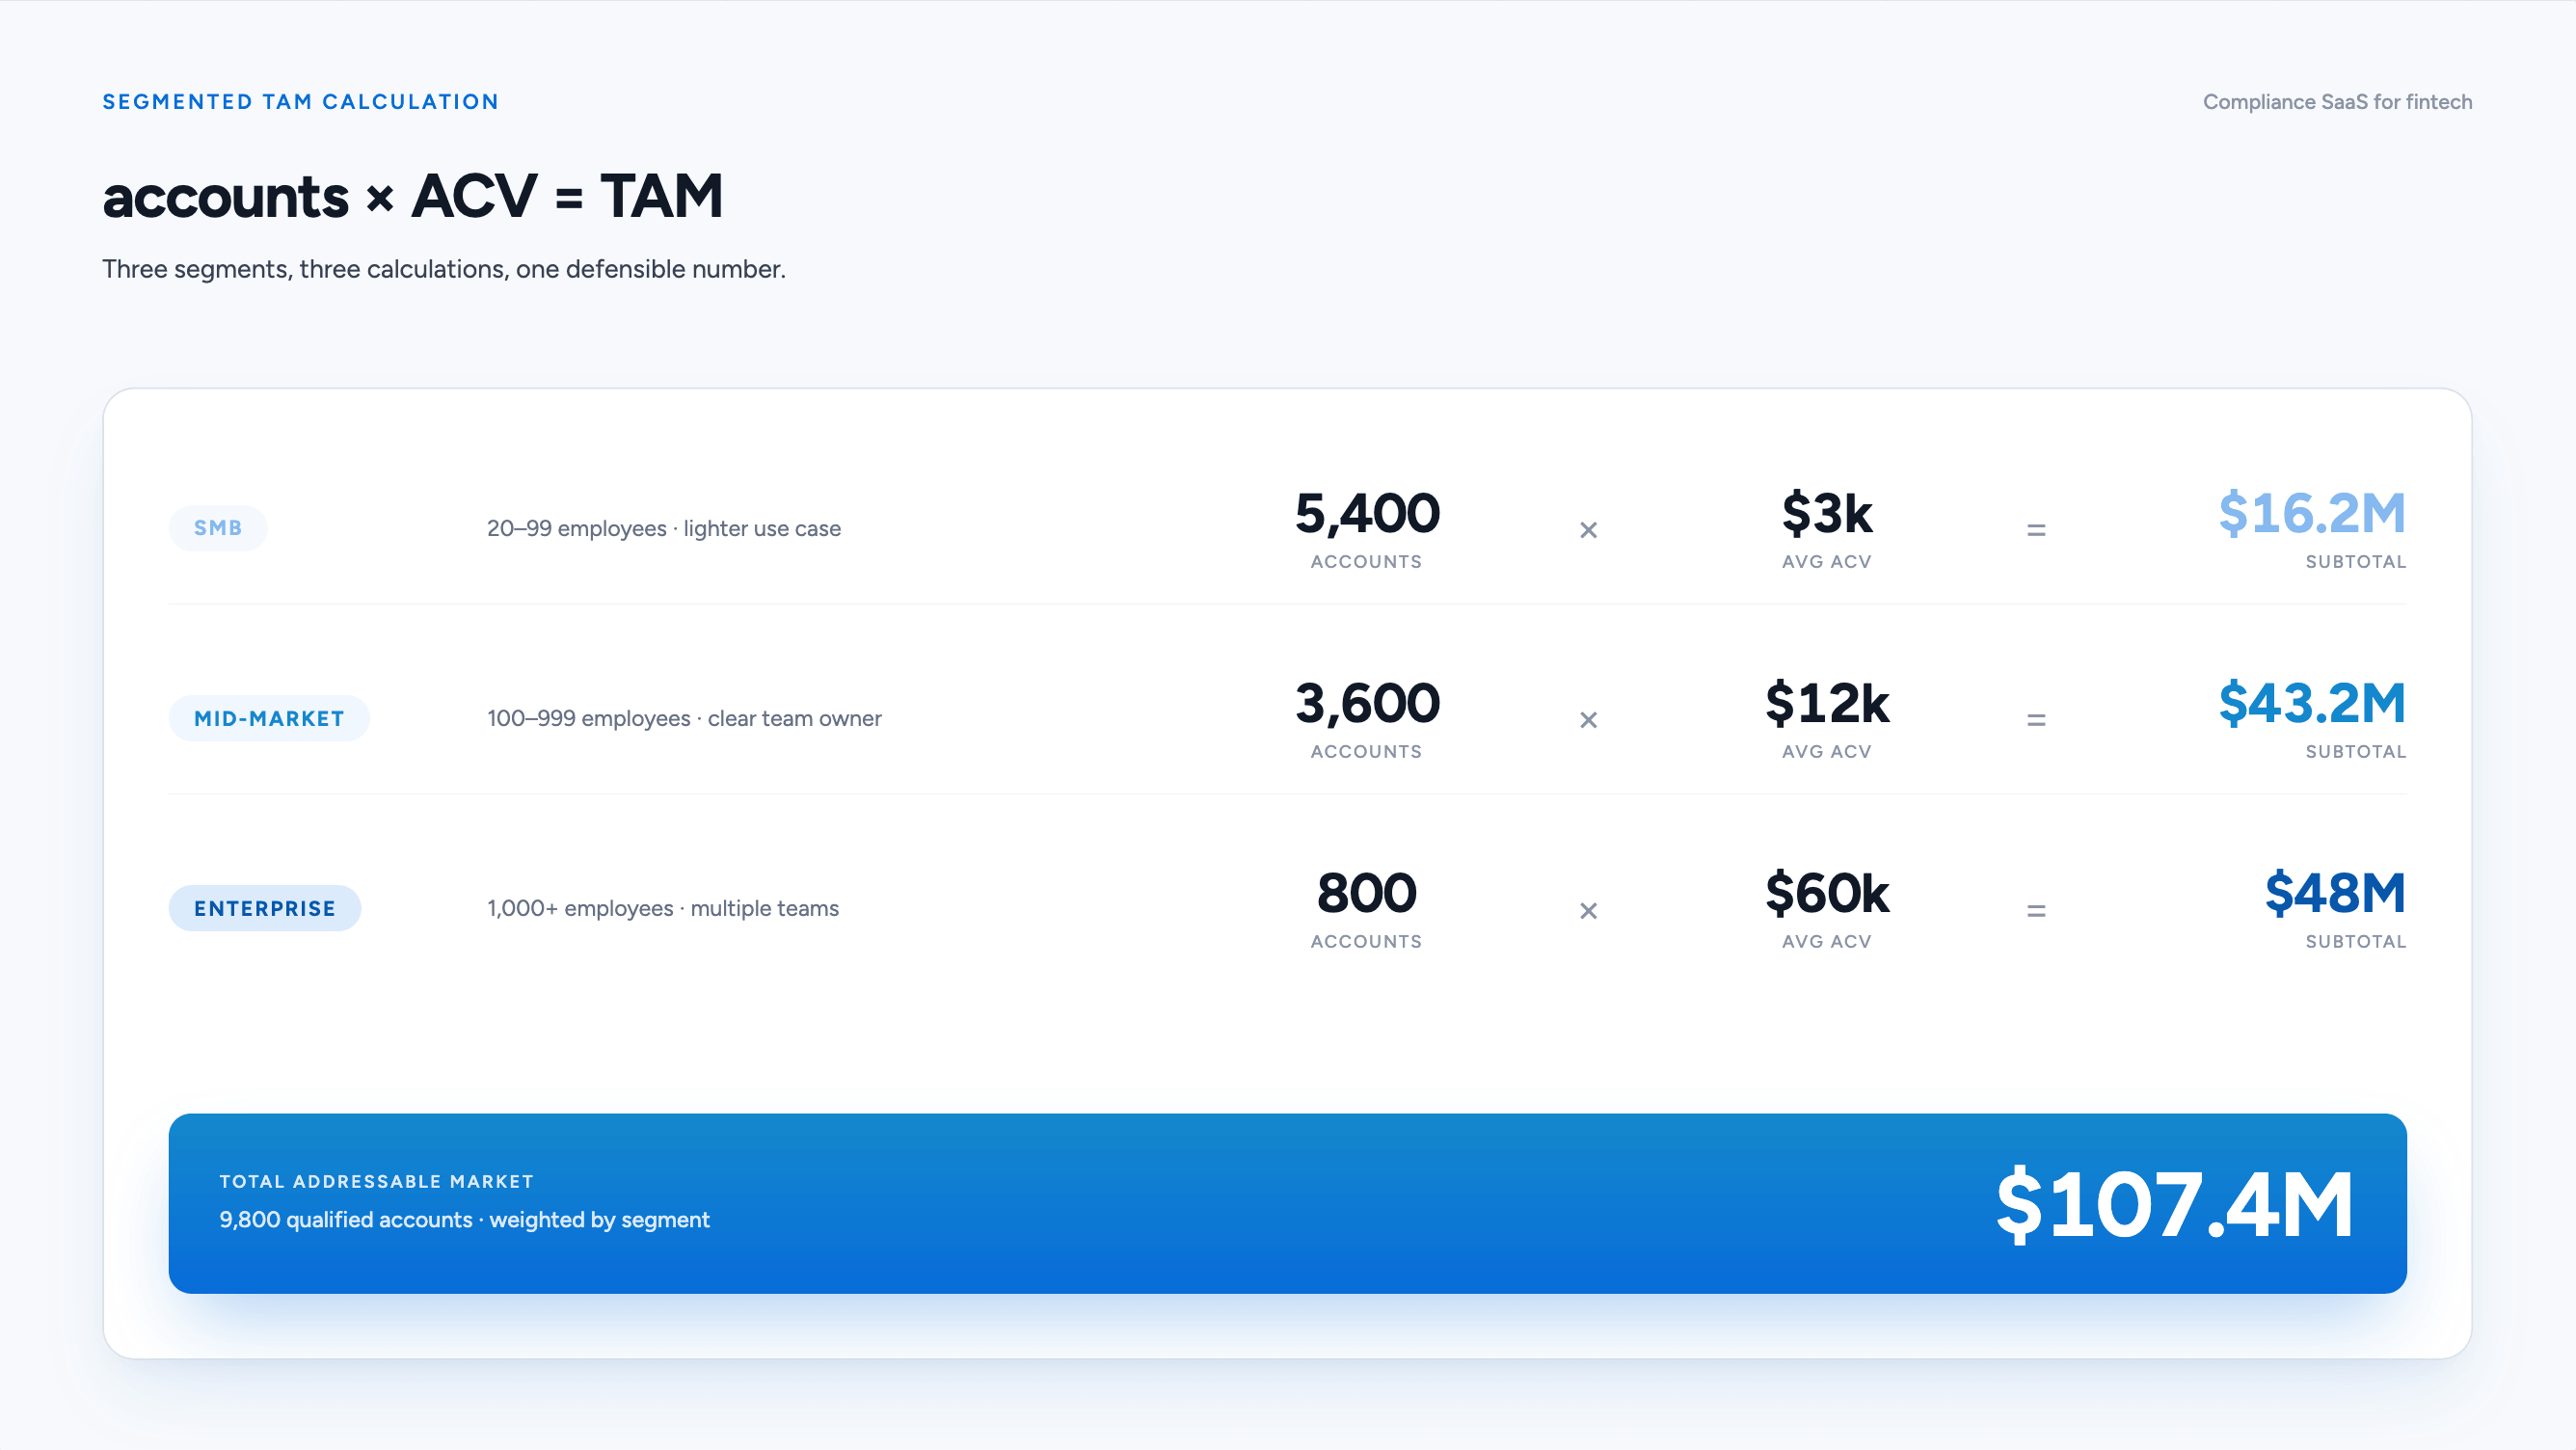
The blended ACV implied by that mix is about $11,000, not $18,000. If you had assumed a flat $18,000 ACV across all 9,800 accounts, you would have reported a $176.4M TAM: a 64% overstatement driven entirely by an averaging shortcut. That gap is exactly the kind of hidden assumption that makes investors distrust a TAM model.
Apply the same segment logic to SAM and SOM. SAM keeps only the accounts you can serve today. SOM keeps only what sales can realistically win in the next three years:
SAM (serviceable, weighted by segment):
SMB:         2,300 accounts x $3,000  = $6.9M
Mid-market:  1,500 accounts x $12,000 = $18.0M
Enterprise:    400 accounts x $60,000 = $24.0M
-----------------------------------------------
SAM:         4,200 accounts          = $48.9M

SOM (winnable over 3 years, weighted by segment):
SMB:           150 accounts x $3,000  = $0.45M
Mid-market:    120 accounts x $12,000 = $1.44M
Enterprise:     30 accounts x $60,000 = $1.8M
-----------------------------------------------
SOM:           300 accounts          = $3.69M
The three layers now nest cleanly: 9,800 accounts down to 4,200 down to 300, and $107.4M down to $48.9M down to $3.69M. Every number traces back to a segment account count and a segment ACV you can defend.
Your SAM filters might include:
- Geography.
- Language.
- Compliance requirements.
- Product integrations.
- Sales coverage.
- Pricing fit.
- Data availability.
Your SOM filters should include:
- Sales headcount.
- Outbound capacity.
- Inbound demand.
- Conversion rates.
- Competitive pressure.
- Procurement timelines.
- Existing customer proof.
TAM is the opportunity.
SAM is the reachable opportunity.
SOM is the operating plan.
Step 8: Refresh the market map
The final step is what makes this a modern TAM workflow.
Do not let the model sit untouched for a year.
Refresh it when:
- You launch a new product.
- Your pricing changes.
- Your ICP changes.
- You enter a new geography.
- Your ICP evidence changes.
- New companies enter the category.
- Existing companies grow into your target band.
For early-stage companies, I like quarterly TAM reviews. Once the GTM motion stabilizes, an annual strategic refresh plus monthly account-list updates is usually enough.
What to do: Treat TAM as a market map, not a one-time spreadsheet. The number matters, but the underlying account universe matters more.
Where CompanyEnrich Fits in AI Market Sizing
CompanyEnrich is a B2B data enrichment API platform. For AI market sizing, the relevant pieces are:
- Semantic company search: find companies using natural-language market descriptions and structured filters.
- Similar companies: expand from seed accounts into lookalike companies.
- Company enrichment: turn candidate domains into structured records.
- People search: find relevant contacts after the account-level TAM is built.
For TAM work, CompanyEnrich is not trying to replace your strategy. It gives you the data layer that makes the strategy operational.
You still need to define your ICP. You still need pricing assumptions. You still need sales capacity assumptions. You still need judgment.
But once those are clear, an API workflow can help you answer questions like:
- Which companies look like our ICP or best customers?
- Which accounts match our semantic ICP description?
- Which companies are in our supported geographies and size bands?
- Which accounts should be in TAM but not SAM yet?
- Which accounts are serviceable now?
- Which contacts should sales or partnerships reach next?
That is the difference between a static spreadsheet and a live market map.
What to do: Use CompanyEnrich after you have a clear ICP and ACV assumption. The API should strengthen your TAM model, not hide weak strategic thinking.
Common TAM Calculation Mistakes
Most bad TAM models fail for the same reasons. The mistakes are predictable.
Mistake 1: The 1% fallacy
This is the classic line:
"If we capture just 1% of a $100 billion market, we will build a $1 billion business."
That sounds exciting. It says almost nothing.
Markets are not captured evenly. You need a path to specific accounts, specific buyers, specific budgets, and specific sales motions. A tiny percentage of a giant market is not a strategy.
Mistake 2: Counting the wrong unit
If you price by company, count companies.
If you price by seat, count seats.
If you price by transaction, count transactions.
Many TAM models break because the unit of account does not match the pricing model. A seat-based product cannot simply multiply company count by subscription price unless it also models average seats per company.
Mistake 3: Treating TAM like a forecast
TAM is not what you will sell next year. It is the maximum theoretical opportunity.
SOM is closer to an operating forecast, but even SOM needs to be tied to pipeline capacity, conversion rates, sales headcount, and budget.
Mistake 4: Using stale data
Static databases decay. Companies change names, shut down, hire, shrink, pivot, acquire, and get acquired.
Data quality research from providers such as Cognism and Cleanlist points to a persistent problem: B2B records lose accuracy over time. The exact decay rate varies by industry and source, but the practical lesson is simple. Old account lists make TAM look more precise than it is.
Mistake 5: Ignoring serviceability
Some companies are addressable but not serviceable.
Maybe you do not support their country. Maybe your onboarding cannot handle their compliance requirements. Maybe your integrations are not ready. Maybe your sales team has no coverage in that region.
Those accounts might belong in TAM. They do not belong in SAM yet.
Mistake 6: Hiding assumptions
A TAM model is only as credible as its assumptions.
Show your account filters. Show your ACV logic. Show your exclusions. Show the sources you used. Show how you moved from TAM to SAM to SOM.
The more visible the logic, the easier it is to trust.
What to do: Add an "assumptions" section to every TAM model. If a number changes the conclusion, make that assumption visible.
How Often Should You Recalculate TAM?
You should recalculate TAM whenever your market definition changes.
For early-stage B2B companies, quarterly review is a good rhythm because the ICP is still moving. Your first wedge might change. Pricing might change. Sales might discover that a smaller segment buys faster. A new integration might make a new market serviceable.
For later-stage companies, the full TAM model may only need an annual strategic update, but the account list underneath it should refresh more often.
Use this rule:
| Trigger | What to update |
|---|---|
| New pricing | ACV assumptions and segment weights |
| New geography | SAM filters and serviceability |
| New product line | ICP definition and account universe |
| New integration | Serviceable segment and sales plays |
| New best-customer pattern | Similar-company seeds and semantic queries |
| Sales capacity change | SOM assumptions |
This is where the "live market map" concept matters. The TAM number can stay relatively stable while the accounts inside the TAM change every month.
Your market is alive. Your model should be too.
Quick Checklist: How to Calculate TAM the Modern Way
Use this checklist when building your TAM model:
- Define your narrative ICP: industry, business model, buyer pain, use case, and buying context.
- Define your firmographic ICP: geography, employee count, revenue band, technologies, and maturity criteria.
- Build the first seed list with semantic search or one known good-fit lookalike query.
- Pull the first 100 candidate companies.
- Pick the first, middle, and last relevant seed results.
- Run those selected companies through a similar companies engine.
- Enrich every candidate company with structured data.
- Filter using the firmographic ICP fields.
- Deduplicate by domain and remove irrelevant subsidiaries or inactive companies.
- Run an LLM fit check using the narrative ICP, without repeating firmographic filters.
- Keep ICP-fit accounts as the focused TAM list.
- Segment the focused list by serviceability and likely ACV.
- Calculate TAM, SAM, and SOM using qualified accounts and realistic ACV.
- Validate against top-down market data.
- Refresh the account universe as the market changes.
That is the modern way to calculate TAM.
Not just a number.
A market map.
Ready to Build an Account-Level TAM?
If you already have a clear ICP and want to turn it into a live account universe, start with CompanyEnrich semantic search and similar company discovery.
Build the model. Find the accounts. Keep it fresh.
Frequently Asked Questions
How do you calculate TAM?
To calculate TAM, multiply the number of potential customers in your target market by your average annual contract value. For B2B SaaS, the most useful formula is usually qualified accounts x realistic ACV = TAM. If pricing is seat-based or transaction-based, adjust the formula so the counted unit matches the pricing model.
What is the formula for how to calculate TAM in B2B SaaS?
The standard B2B SaaS TAM formula is qualified account count x average annual contract value. For seat-based pricing, use qualified accounts x average seats per account x price per seat x 12. For usage-based pricing, calculate expected annual usage per account, then multiply by the number of qualified accounts.
What is the difference between TAM, SAM, and SOM?
TAM is the total theoretical market opportunity. SAM is the part of that opportunity your company can currently serve based on product, geography, integrations, and GTM constraints. SOM is the portion you can realistically capture in the near term based on sales capacity, budget, conversion rates, and competition.
Is top-down or bottom-up TAM better?
Bottom-up TAM is usually better for B2B SaaS because it starts with real accounts and realistic pricing. Top-down TAM is still useful as a sanity check, especially when credible analyst data exists. The strongest models use bottom-up TAM as the core calculation and top-down data to validate that the result is not wildly out of range.
How can AI help calculate TAM?
AI helps calculate TAM by improving account discovery. Semantic search can find companies based on natural-language descriptions, while similar-company APIs can expand from seed accounts into lookalike companies. This makes the TAM model more operational because it produces both a market number and an account-level list.
How does semantic search improve TAM analysis?
Semantic search improves TAM analysis by finding companies based on what they do, not only what industry code or keyword they match. This is useful in modern B2B markets where categories are messy and fast-changing. A query like "AI infrastructure startups selling observability tools to developers" can capture a market that traditional filters may miss.
How often should a company update its TAM model?
Early-stage companies should review TAM quarterly because ICP, pricing, and serviceability often change quickly. Mature companies can update the full strategic TAM annually, but should refresh the account list more frequently. Any major change in product, geography, pricing, sales capacity, or ICP should trigger a TAM review.
Can CompanyEnrich be used to calculate TAM?
Yes. CompanyEnrich can support TAM calculation by helping teams find similar companies, run semantic company searches, enrich matched accounts, and build account-level market lists. The strategy and assumptions still come from your team, but the API layer helps turn those assumptions into a searchable, refreshable company universe.

Co-Founder & CEO of CompanyEnrich
Written by Amir, co-founder and CEO of CompanyEnrich. He has 10+ years of experience in B2B SaaS and data infrastructure, and previously founded and exited two B2B SaaS startups before starting CompanyEnrich. He now helps enterprises and startups integrate B2B intelligence into AI agents, workflows, and GTM operations.
Connect on LinkedIn